Module LightPilot: Difference between revisions
Eric.seigne (talk | contribs) (module lightpilot) Tag: 2017 source edit |
Eric.seigne (talk | contribs) (LightPilot 1.3.1) |
||
| (3 intermediate revisions by the same user not shown) | |||
| Line 1: | Line 1: | ||
[[Category: | [[fr:Module_LightPilot_FR]] | ||
[[Category:Complementary modules]] | |||
[[Category:CRM]] | [[Category:CRM]] | ||
[[Category:CAP-REL]] | [[Category:CAP-REL]] | ||
{{ | {{TemplateDocDevEn}} | ||
{{ | {{TemplateDocUser}} | ||
= | =Information= | ||
{{TemplateModuleInfo | {{TemplateModuleInfo | ||
|modulename=Lightpilot | |modulename=Lightpilot | ||
| Line 11: | Line 12: | ||
|webbuy={{LinkToPluginDownloadDoliStore|keyword=lightpilot}} | |webbuy={{LinkToPluginDownloadDoliStore|keyword=lightpilot}} | ||
|status=stable | |status=stable | ||
|prerequisites= | |prerequisites=Invoices module; Commercial proposals, Sales orders, Banks and Accounting recommended | ||
|minversion=18.0.0 | |minversion=18.0.0 | ||
|note= | |note=Business dashboard for small companies: sales KPIs, revenue, cash flow, net margin, forecasts and break-even point, computed from the data already stored in Dolibarr. | ||
}} | }} | ||
= | =Features= | ||
Lightpilot | Dolibarr already holds all your sales and financial data. Lightpilot gathers it on a single screen: open the page and you know where your company stands, with no export and no spreadsheet. | ||
==At a glance== | |||
* '''Who it is for''': owners and managers of small companies, sales managers, anyone who follows the business day to day in Dolibarr. | |||
* '''What it does''': it reads your proposals, orders, invoices, payments, bank entries and validated accounting entries, and shows them as indicators, charts and follow-up tables. | |||
* '''What it does not do''': it never creates nor changes a sales or accounting document (it only stores its settings and your break-even thresholds), it sends none of your data to an outside service, and it replaces neither your accounting nor your accountant's advice. | |||
==Feature list== | |||
* '''Key indicators (KPI)''' - seven indicators: invoiced revenue compared with the same window of the previous year, projected revenue for the fiscal year, proposal pipeline, open orders, customer receivables, transformation rate and conversion rate. | |||
* '''Charts''' - monthly revenue (invoiced, collected, previous year and a 3-month projection), sales funnel, cash flow, monthly net margin in a management view and an accounting view. | |||
* '''Break-even point by segments''' - a monthly threshold excluding tax, set from a given date; a new hire or a change in fixed costs becomes a new segment, and the line is drawn as steps on the revenue chart. | |||
* '''Follow-up tables''' - aged receivables, top customers, top products and services, proposals to follow up, overdue invoices, orders to process, sales by category. | |||
* '''Advanced analytics''' - revenue forecasts, period comparison, seasonality, DSO (days sales outstanding), average basket, statistics by sales representative, by product category and by area. | |||
* '''Inactive customers and GDPR''' - detection of customers with no recent activity, alert when the legal retention period comes near, churn and retention rates. | |||
* '''PDF export''' - a report of the dashboard for the selected period. | |||
* '''Period filter''' - current month, quarter or year, current fiscal year, previous year or the year before. | |||
* '''Seven languages''' - English, French, German, Spanish, Italian, Dutch and Brazilian Portuguese. | |||
==Screenshots== | |||
<gallery widths="300px" heights="200px"> | |||
File:LightPilot tableau-de-bord.png|Dashboard: key indicators, revenue and cash flow | |||
File:LightPilot kpi-cards.png|The key indicator cards | |||
File:LightPilot graphique-chiffre-affaires.png|Monthly revenue, 3-month projection and break-even line | |||
File:LightPilot graphique-marge-nette.png|Monthly net margin: revenue minus purchases, social charges and salaries | |||
File:LightPilot graphique-tresorerie.png|Cash flow: money in, money out and balance | |||
File:LightPilot configuration.png|Module setup page | |||
</gallery> | |||
=Links= | |||
* [https://doc.cap-rel.fr/lightpilot/?lang=en Module documentation] | |||
* [https://doc.cap-rel.fr/lightpilot/nouveautes-1-3-1 What's new in version 1.3.1] (in French) | |||
* [https://dolinews.com/en/projets/lightpilot Get update notifications] | |||
* [https://cap-rel.fr/sav-module-dolibarr/ Support form] | |||
* [https://dolitest.fr/lightpilot/ Online demo]: a Dolibarr with a full data set, created for you in less than 20 seconds and removed after the session | |||
=Requirements= | |||
{| class="wikitable" | |||
! Item !! Version or condition | |||
|- | |||
| Dolibarr || 18.0 or higher | |||
|- | |||
| PHP || 7.4 or higher | |||
|- | |||
| Rights || an administrator account to install, enable and set up the module | |||
|} | |||
Lightpilot uses the data of the following Dolibarr modules. The more you enable, the more complete the dashboard; a missing module simply hides the blocks that depend on it. | |||
{| class="wikitable" | |||
! Dolibarr module !! Data used | |||
|- | |||
| Invoices || revenue, customer receivables, aged receivables, top customers, overdue invoices | |||
|- | |||
| Commercial proposals || proposal pipeline, transformation and conversion rates, proposals to follow up, sales funnel | |||
|- | |||
| Sales orders || open orders, orders to process, sales funnel | |||
|- | |||
| Banks || cash flow and bank account balances | |||
|- | |||
| Accounting || monthly net margin from validated entries | |||
|} | |||
=Installation= | =Installation= | ||
{{ | {{InstallModuleDoliStoreEn|keyword=lightpilot}} | ||
==Upgrade== | |||
# Install the new version through '''Home > Setup > Modules/Applications > Deploy/install external app/module'''. | |||
# Disable then enable the module again: enabling applies the database upgrades and registers the new permissions. | |||
Your settings and break-even thresholds are kept. | |||
==Uninstall== | |||
Disable the module from '''Home > Setup > Modules/Applications'''. Settings and break-even thresholds stay in the database: enabling the module again later finds them back. | |||
=Setup= | |||
{{ActivationModuleEn}} | |||
The setup is in '''Home > Setup > Modules > Lightpilot'''. It has four tabs: '''Settings''', '''Break-even thresholds''', '''Demonstration data''' and '''About'''. | |||
==Settings== | |||
{| class="wikitable" | |||
! Setting !! Purpose !! Default | |||
|- | |||
| Default period || period shown when the dashboard opens (current month, quarter or year) || current year | |||
|- | |||
| Age of proposals to follow up || number of days after which an open proposal enters the list of proposals to follow up || 15 days | |||
|- | |||
| Number of items in lists || maximum size of each follow-up table || 10 | |||
|- | |||
| Good / bad transformation rate || above the first threshold the rate is shown in green, below the second in red || 50 % / 30 % | |||
|- | |||
| Inactivity threshold || months without a proposal, order or invoice before a customer counts as inactive || 12 months | |||
|- | |||
| GDPR limit || time after which the data of an inactive customer must be anonymized || 36 months | |||
|- | |||
| Bank accounts for cash flow || accounts used for the cash flow (section shown when the Banks module is enabled); none selected = all open accounts || all open accounts | |||
|} | |||
==Accounting net margin== | |||
When the Accounting module is enabled, the net margin chart in accounting view reads the validated entries by account prefixes. The defaults follow the French chart of accounts: revenue <code>70</code>, purchases <code>60,61,62</code>, social charges <code>63,645</code>, salaries <code>641,644</code>. Change them if your chart of accounts differs. | |||
==Break-even thresholds== | |||
The '''Break-even thresholds''' tab stores the monthly revenue excluding tax needed to cover your fixed costs. Each threshold applies from a date until the next one. Example: 2,000 euros from January 1st, then 5,000 euros from March 1st, the date of a new hire. Earlier thresholds never need editing. With no threshold, the line is not drawn. | |||
==Demonstration data== | |||
The '''Demonstration data''' tab generates, then purges, a full data set (third parties, catalog, proposals, orders, invoices, payments, charges, salaries, thresholds) covering more than two years of history. It is meant for a test or presentation instance: generation is refused as soon as the entity holds a real validated invoice, and the purge only removes the rows marked by the module. | |||
=Permissions= | |||
Access to the module pages is controlled by a single permission, '''Read Lightpilot dashboard'''. An administrator grants it to a user or a group from '''Home > Users & Groups''', '''Permissions''' tab. The indicators cover the documents of the whole entity: grant this permission only to people allowed to see the company's revenue and cash. | |||
=Usage= | |||
Once the module is enabled, a '''Lightpilot''' menu appears in the top bar, with two entries: '''Dashboard''' and '''Advanced Analytics'''. | |||
==Dashboard== | |||
The top of the page shows the indicator cards, followed by the charts and the follow-up tables. Hover over a card to see how it is computed. | |||
==Choosing the period== | |||
The selector at the top of the page applies to the indicators and to the trend charts. Three deliberate exceptions: | |||
* blocks marked '''(as of today)''' (receivables, aged receivables, follow-ups, overdue invoices, orders to process, bank balance) describe the present situation; | |||
* the '''projected annual revenue''' card always covers the current fiscal year; | |||
* a period shorter than three months is widened to three months on the charts. | |||
==Excluding or including tax== | |||
Every label states <code>(excl. tax)</code> or <code>(incl. tax)</code>. Sales indicators (revenue, pipeline, margins) exclude tax; amounts to collect (receivables, aged receivables, overdue invoices) and cash flow include tax. Credit notes are deducted from revenue. | |||
==Advanced analytics and PDF export== | |||
The '''Advanced Analytics''' page gathers forecasts, period comparison, seasonality, DSO, average basket, statistics by sales representative, by category and by area, and inactive customers. Its '''PDF Export''' button produces a report of the dashboard for the selected period. | |||
==Lightpilot as home page== | |||
In your user card, '''Settings''' tab, pick '''Lightpilot Home''' in the '''Landing page''' list: the dashboard opens right after login. | |||
Each indicator and chart is described in the [https://doc.cap-rel.fr/lightpilot/utilisation?lang=en user guide]. | |||
=FAQ= | |||
'''The dashboard shows zero amounts.'''<br> | |||
Check that the Commercial proposals, Sales orders or Invoices modules are enabled, that documents exist in the selected period and that they are validated. | |||
'''The break-even line does not show.'''<br> | |||
It is drawn only once a threshold is set in the '''Break-even thresholds''' tab. After an upgrade, disable then enable the module to create the thresholds table. | |||
'''The cash flow section does not show.'''<br> | |||
It is displayed only when the Banks module is enabled. | |||
'''What is the difference between transformation rate and conversion rate?'''<br> | |||
The transformation rate divides signed proposals by closed proposals (signed and refused). The conversion rate divides proposals turned into an order or an invoice by all proposals of the period, open ones included. | |||
'''How is the projected annual revenue computed?'''<br> | |||
It adds the revenue already invoiced in the fiscal year, open proposals weighted by your historical transformation rate, open orders weighted at 95 % and the recurring invoices still to be generated. | |||
'''The PDF export fails.'''<br> | |||
Check that the <code>documents/lightpilot/</code> directory of your installation is writable by the web server. | |||
All questions: [https://doc.cap-rel.fr/lightpilot/faq?lang=en documentation FAQ]. | |||
=Development= | |||
Developments and improvements can be suggested to the project maintainer by email (see the headers of the source files) or through the [https://cap-rel.fr/sav-module-dolibarr/ support form]. | |||
Latest revision as of 08:34, 20 October 2026


Information
| Module name | Lightpilot |
| Editor / Editeur | CAP-REL - www.cap-rel.fr |
| Download or buy page / Page achat ou téléchargement | External module - www.dolistore.com |
| Status / Statut / Estado | Stable |
| Prerequisites / Prérequis | Invoices module; Commercial proposals, Sales orders, Banks and Accounting recommended
Dolibarr min version: See on Dolistore Dolibarr max version: See on Dolistore |
| Last update date / Date mise à jour fiche / Fecha última actualización | 2026-10-20 |
| Note / Nota | Business dashboard for small companies: sales KPIs, revenue, cash flow, net margin, forecasts and break-even point, computed from the data already stored in Dolibarr. |
Features
Dolibarr already holds all your sales and financial data. Lightpilot gathers it on a single screen: open the page and you know where your company stands, with no export and no spreadsheet.
At a glance
- Who it is for: owners and managers of small companies, sales managers, anyone who follows the business day to day in Dolibarr.
- What it does: it reads your proposals, orders, invoices, payments, bank entries and validated accounting entries, and shows them as indicators, charts and follow-up tables.
- What it does not do: it never creates nor changes a sales or accounting document (it only stores its settings and your break-even thresholds), it sends none of your data to an outside service, and it replaces neither your accounting nor your accountant's advice.
Feature list
- Key indicators (KPI) - seven indicators: invoiced revenue compared with the same window of the previous year, projected revenue for the fiscal year, proposal pipeline, open orders, customer receivables, transformation rate and conversion rate.
- Charts - monthly revenue (invoiced, collected, previous year and a 3-month projection), sales funnel, cash flow, monthly net margin in a management view and an accounting view.
- Break-even point by segments - a monthly threshold excluding tax, set from a given date; a new hire or a change in fixed costs becomes a new segment, and the line is drawn as steps on the revenue chart.
- Follow-up tables - aged receivables, top customers, top products and services, proposals to follow up, overdue invoices, orders to process, sales by category.
- Advanced analytics - revenue forecasts, period comparison, seasonality, DSO (days sales outstanding), average basket, statistics by sales representative, by product category and by area.
- Inactive customers and GDPR - detection of customers with no recent activity, alert when the legal retention period comes near, churn and retention rates.
- PDF export - a report of the dashboard for the selected period.
- Period filter - current month, quarter or year, current fiscal year, previous year or the year before.
- Seven languages - English, French, German, Spanish, Italian, Dutch and Brazilian Portuguese.
Screenshots
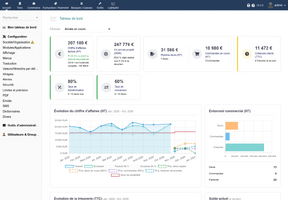
Dashboard: key indicators, revenue and cash flow
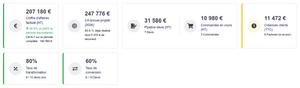
The key indicator cards
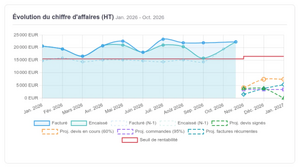
Monthly revenue, 3-month projection and break-even line
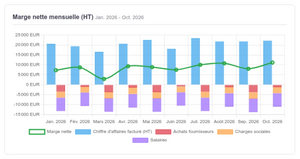
Monthly net margin: revenue minus purchases, social charges and salaries
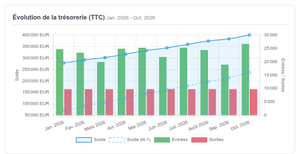
Cash flow: money in, money out and balance
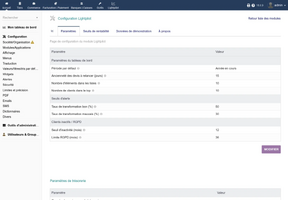
Module setup page


Links
- Module documentation
- What's new in version 1.3.1 (in French)
- Get update notifications
- Support form
- Online demo: a Dolibarr with a full data set, created for you in less than 20 seconds and removed after the session
Requirements
| Item | Version or condition |
|---|---|
| Dolibarr | 18.0 or higher |
| PHP | 7.4 or higher |
| Rights | an administrator account to install, enable and set up the module |
Lightpilot uses the data of the following Dolibarr modules. The more you enable, the more complete the dashboard; a missing module simply hides the blocks that depend on it.
| Dolibarr module | Data used |
|---|---|
| Invoices | revenue, customer receivables, aged receivables, top customers, overdue invoices |
| Commercial proposals | proposal pipeline, transformation and conversion rates, proposals to follow up, sales funnel |
| Sales orders | open orders, orders to process, sales funnel |
| Banks | cash flow and bank account balances |
| Accounting | monthly net margin from validated entries |
Installation
- Download archive file of module (.zip file) from web site www.dolistore.com or from any other source.
- Install module into the /custom folder of Dolibarr:
- Go to Home - Setup - Modules - Deploy/install external app/module
- Upload the file. Note: If it fails because upload from this page has been locked by your web hosting provider, you can manually unzip the file into the /custom directory from command line: Go into the /custom directory and uncompress file with command unzip modulefile.zip then check that the directory with the nameof the module is inside the /custom directory. If into a subdirectory, just move it into /custom.
- Module should be ready to be activated and used.
Upgrade
- Install the new version through Home > Setup > Modules/Applications > Deploy/install external app/module.
- Disable then enable the module again: enabling applies the database upgrades and registers the new permissions.
Your settings and break-even thresholds are kept.
Uninstall
Disable the module from Home > Setup > Modules/Applications. Settings and break-even thresholds stay in the database: enabling the module again later finds them back.
Setup
To use this module, you must first enable it using an administrator account, via the menu option "Home - Setup - Modules".
Choose the tab where the module is listed. Then click on "Activate".
The module is now activated.
If a cog icon appears  on module thumb or at end of the line of the module, click on it to access the setup page specific to the module.
The setup is in Home > Setup > Modules > Lightpilot. It has four tabs: Settings, Break-even thresholds, Demonstration data and About.
Settings
| Setting | Purpose | Default |
|---|---|---|
| Default period | period shown when the dashboard opens (current month, quarter or year) | current year |
| Age of proposals to follow up | number of days after which an open proposal enters the list of proposals to follow up | 15 days |
| Number of items in lists | maximum size of each follow-up table | 10 |
| Good / bad transformation rate | above the first threshold the rate is shown in green, below the second in red | 50 % / 30 % |
| Inactivity threshold | months without a proposal, order or invoice before a customer counts as inactive | 12 months |
| GDPR limit | time after which the data of an inactive customer must be anonymized | 36 months |
| Bank accounts for cash flow | accounts used for the cash flow (section shown when the Banks module is enabled); none selected = all open accounts | all open accounts |
Accounting net margin
When the Accounting module is enabled, the net margin chart in accounting view reads the validated entries by account prefixes. The defaults follow the French chart of accounts: revenue 70, purchases 60,61,62, social charges 63,645, salaries 641,644. Change them if your chart of accounts differs.
Break-even thresholds
The Break-even thresholds tab stores the monthly revenue excluding tax needed to cover your fixed costs. Each threshold applies from a date until the next one. Example: 2,000 euros from January 1st, then 5,000 euros from March 1st, the date of a new hire. Earlier thresholds never need editing. With no threshold, the line is not drawn.
Demonstration data
The Demonstration data tab generates, then purges, a full data set (third parties, catalog, proposals, orders, invoices, payments, charges, salaries, thresholds) covering more than two years of history. It is meant for a test or presentation instance: generation is refused as soon as the entity holds a real validated invoice, and the purge only removes the rows marked by the module.
Permissions
Access to the module pages is controlled by a single permission, Read Lightpilot dashboard. An administrator grants it to a user or a group from Home > Users & Groups, Permissions tab. The indicators cover the documents of the whole entity: grant this permission only to people allowed to see the company's revenue and cash.
Usage
Once the module is enabled, a Lightpilot menu appears in the top bar, with two entries: Dashboard and Advanced Analytics.
Dashboard
The top of the page shows the indicator cards, followed by the charts and the follow-up tables. Hover over a card to see how it is computed.
Choosing the period
The selector at the top of the page applies to the indicators and to the trend charts. Three deliberate exceptions:
- blocks marked (as of today) (receivables, aged receivables, follow-ups, overdue invoices, orders to process, bank balance) describe the present situation;
- the projected annual revenue card always covers the current fiscal year;
- a period shorter than three months is widened to three months on the charts.
Excluding or including tax
Every label states (excl. tax) or (incl. tax). Sales indicators (revenue, pipeline, margins) exclude tax; amounts to collect (receivables, aged receivables, overdue invoices) and cash flow include tax. Credit notes are deducted from revenue.
Advanced analytics and PDF export
The Advanced Analytics page gathers forecasts, period comparison, seasonality, DSO, average basket, statistics by sales representative, by category and by area, and inactive customers. Its PDF Export button produces a report of the dashboard for the selected period.
Lightpilot as home page
In your user card, Settings tab, pick Lightpilot Home in the Landing page list: the dashboard opens right after login.
Each indicator and chart is described in the user guide.
FAQ
The dashboard shows zero amounts.
Check that the Commercial proposals, Sales orders or Invoices modules are enabled, that documents exist in the selected period and that they are validated.
The break-even line does not show.
It is drawn only once a threshold is set in the Break-even thresholds tab. After an upgrade, disable then enable the module to create the thresholds table.
The cash flow section does not show.
It is displayed only when the Banks module is enabled.
What is the difference between transformation rate and conversion rate?
The transformation rate divides signed proposals by closed proposals (signed and refused). The conversion rate divides proposals turned into an order or an invoice by all proposals of the period, open ones included.
How is the projected annual revenue computed?
It adds the revenue already invoiced in the fiscal year, open proposals weighted by your historical transformation rate, open orders weighted at 95 % and the recurring invoices still to be generated.
The PDF export fails.
Check that the documents/lightpilot/ directory of your installation is writable by the web server.
All questions: documentation FAQ.
Development
Developments and improvements can be suggested to the project maintainer by email (see the headers of the source files) or through the support form.