Environment and development tools - Optional
This page describes optional components you may install to support more technologies for development of Dolibarr. They are not required to develop Dolibarr nor modules but may be useful for specific development.
If you want to make Perl scripts
- Install the Eclipse plugin for Perl: EPIC
For this, use the Find And Install process and add the update URL:
https://e-p-i-c.sourceforge.net/updates or
https://www.epic-ide.org/updates/
If you want to make Python scripts
- Install the Eclipse plugin for Python: PyDev
For this, use the Find And Install process and add the update URL: http://pydev.org/updates
If you are using Windows
- Notepad++ (for those who can't stand java or are using a computer too old for Eclipse).
- WinMerge (to compare files and directories)
- CygWin (to have the "patch" command)
If you want to do step by step debugging or tuning (XDebug)
- To add global tuning information, from dolibarr 3.8, for pages on your browser javascript console log, add environment variable MAIN_SHOW_TUNING_INFO to 1 on your webserver.
For Apache, just add the following line into your apache.conf:
SetEnv MAIN_SHOW_TUNING_INFO 1
</source>
For Nginx, add the following line to your php location:
<syntaxhighlight lang="ini">
fastcgi_param MAIN_SHOW_TUNING_INFO true;
</source>
The variable name is DOL_TUNING for versions of Dolibarr < 3.8.

*Install XDebug:

===[[File:Logo_windows.png|24px]] In Windows===

*Download dll file '''php_debug_xxx.dll''' on http://www.xdebug.org and store it in directory /ext of php. Then enable plugin.

*Modify php.ini file to add parameters:

<syntaxhighlight lang="ini">
 [xdebug]
 xdebug.remote_enable=on
 xdebug.remote_handle=dbgp
 xdebug.remote_host=localhost
 xdebug.remote_port=9000
 xdebug.show_local_vars=off
 xdebug.profiler_output_dir=c:/temp
 xdebug.profiler_append=0
 xdebug.profiler_enable=0
 xdebug.profiler_enable_trigger=1
 In Ubuntu / Linux
- Install package php-xdebug:
sudo apt-get install php-xdebug
- Modify xdebug.ini to add parameters after the line zend_extension=xxx (or similar):
 ; With xdebug 2.1 and more
 xdebug.remote_enable=on
 xdebug.remote_handle=dbgp
 xdebug.remote_host=localhost
 xdebug.remote_port=9000
 xdebug.show_local_vars=off
 xdebug.profiler_output_dir=/var/tmp
 xdebug.profiler_enable=0
 xdebug.profiler_enable_trigger=1
 ; Add also this with xdebug 2.2 and more
 xdebug.show_mem_delta=1
 xdebug.trace_output_dir=/var/tmp
 xdebug.auto_trace=0
 xdebug.trace_enable_trigger=1
 Eclipse configuration
- Open Eclipse. In Window->Preferences->General->Web Browser, select external web browser, and set it to Default system web browser.
- Go into the debug section, by Window->Preferences->PHP->Debug, and set the PHP Debugger option to XDebug (by default this is set to the Zend Debugger). Note the chekbox “Break at first line” in this page as well – you can change this later on, as required.
- After you’ve applied your changes, go into the PHP Debug prespective, and go to menu Debug Configurations… Here, make sure the Server Debugger is set to XDebug, and that the PHP server points to http://localhost/ or an appropriate server location. The file section should point to the file to be debugged, relative to your workspace, the relative path maybe something /dolibarr/htdocs/index.php.
- Check the URL section to see whether it points to the correct location – if not, make sure you uncheck the “Auto-Generate” check box, and enter in the correct location. Apply the changes and close the dialog box.
- You should now be ready to debug Dolibarr. Click on Run->Debug or F11 to enable debugging, Eclipse should switch to the Debug View, and the page should start loading in your external browser. If “Break at First Line” checkbox was checked previously, then the program would have “stopped” at the first line. You can step into or step over subsequent lines using the controls on your top left corner. Alternatively, you can place breakpoints at various locations and stop code execution there as well.
Then to analyze files generated by XDebug profiling, you must call the page by adding parameter XDEBUG_PROFILE=1 to generate the file and then install KCacheGrind (Linux) or WinCacheGrind (Windows) to analyze them.
To develop or use Quality controls (PHPUnit, PHPCodeSniffer, PHPCpd, PHPDepends)
From Eclipse
The plugin to provide phpcodesniffer or phpunit for Eclipse is now deprecated.
- PHPUnit is supported by default on a standard Eclipse installation
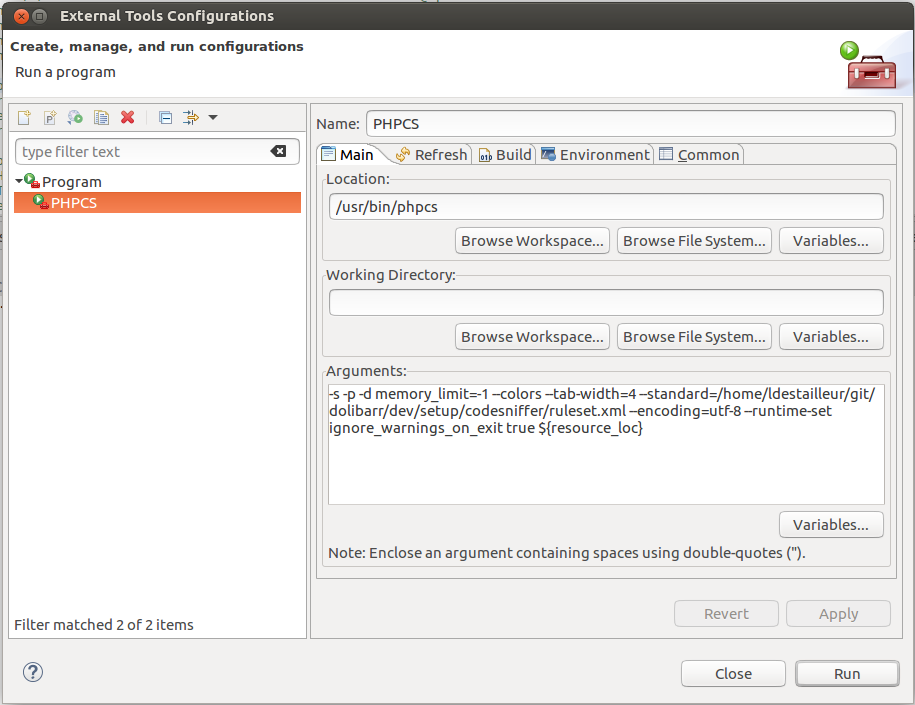
- To get PHP Codesniffer, you can create an entry "External Tools" with this setup
From Command Line
Install PHPUnit
- Project-page: https://phpunit.de/
- Download a release archive from https://github.com/sebastianbergmann/phpunit and extract it to a directory that is listed in the include_path of your php.ini configuration file.
- Module xdebug can also be required if you plan to make reporting of test code covering.
Execute PHPUnit tests or generate code coverage reports
- Go into directory /test of sources. Read file README to know the process to execute one or several unit tests.
Install other quality tools (phpcs, phpcd, phpdepends)
- Take a look at tools documentation (PHPCodeSniffer, PHPPcd, PHPDepends). For example, to install or upgrade PHPCodeSniffer
sudo pear upgrade PHP_CodeSniffer
And check into PHPCodeSniffer setup, that you use the PEAR libraries store into */usr/bin/php*
To develop or use Selenium tests
From Firefox
Install plugin for Firefox Selenium IDE
- Download file of plugin "Selenium IDE" for Firefox.
- Add it into firefox in menu Tools - Complementary modules.
Execute Selenium tests
- Go into menu Tools - Selinum IDE of Firefox.
- Open xml file of the suite tests.
- Execute the test.
To build Doxygen documentation
- Install Doxygen available for download at http://www.doxygen.org (or install package doxygen with Ubuntu).
- Install Eclipse plugin by adding source http://download.gna.org/eclox/update/ into your Eclipse update setup. Then setup your Eclipse (Window-Preferences-Doxygen) to define path to Doxygen tool.
To add asciidoc support into Eclipse
- Add the URL to Install repositories http://download.eclipse.org/mylyn/snapshots/nightly/docs/. Then install package Mylyn Docs - Mylyn Wikitext Extras
